Back To Articles
Descriptive vs Inferential Statistics: Clear Differences with Real Medical Examples
BlogMedical Statistics


In medical research, data alone is not enough. Descriptive statistics organize and summarize collected data for example, showing the average blood pressure in a group of patients. Inferential statistics allow researchers to draw conclusions about a larger population based on that sample.
Both are essential for turning data into actionable insights that support clinical decisions, public health policies, and evidence-based medicine.
In medical studies, both descriptive and inferential statistics belong to the broader branch of statistics known as statistical analysis, which helps researchers turn raw data into meaningful conclusions.
In this article, you’ll discover:
Both descriptive and inferential statistics serve distinct purposes in medical research. Understanding their differences helps ensure studies are properly designed, data is accurately interpreted, and conclusions are reliable.
| Feature | Descriptive Statistics | Inferential Statistics |
| Main Goal | Summarize data | Make predictions or generalizations |
| Focus | The sample data itself | The larger population beyond the sample |
| Key Tools | Mean, median, mode, range, standard deviation, charts | Hypothesis tests, p-values, confidence intervals, regression |
| Uncertainty Measurement | Not addressed | Explicitly calculated (e.g., confidence intervals) |
| When Used | First step in analyzing data | To test hypotheses or estimate broader effects |
| Example | Reporting average blood pressure in 150 patients | Estimating national blood pressure trends based on sample results |
In practice, researchers often begin with descriptive statistics to understand the basic features of the data before applying inferential methods to test hypotheses or estimate broader effects.

Descriptive statistics help organize raw data into understandable summaries. Instead of reviewing hundreds of individual patient records, researchers can quickly see overall patterns in the data.
Descriptive statistics are used to summarize the main features of a dataset. They provide a simple snapshot of the data without making generalizations beyond the sample. In medical research, this helps describe patient characteristics, treatment outcomes, or disease trends.
For example, a study measuring the blood pressure of 200 patients might report the average systolic blood pressure, the range of values, and how spread out the measurements are.
Central tendency shows where most values in the dataset fall:
Dispersion describes how spread out the data points are:

In clinical trials, a high standard deviation might suggest wide variability in patient responses.
For more details on measures of variability used in healthcare research, refer to This article discusses statistical measures of variability.
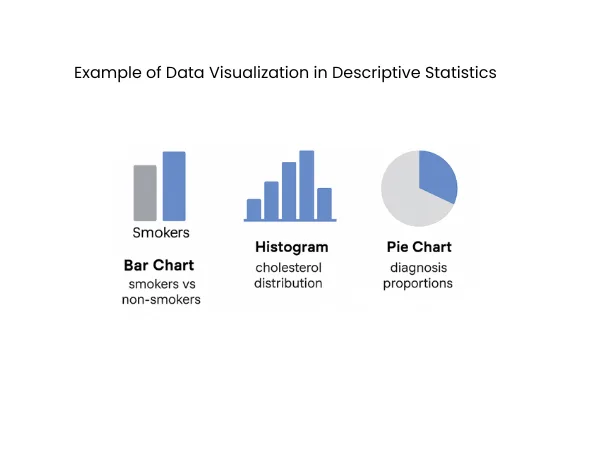
Visual tools make descriptive statistics easier to interpret:
These types of graphical representations make it easier to communicate results to both clinical teams and non-technical audiences.
While descriptive statistics describe data from a specific group, inferential statistics allow researchers to extend conclusions beyond the study sample. In medicine, it’s often impossible to study every patient with a condition. Inferential methods use carefully selected samples to make predictions or test hypotheses about larger populations.
Inferential statistics estimate characteristics of a population based on sample data. They help determine whether observed results are likely to reflect true effects or are due to random chance.
For example, a new cancer treatment tested on 500 patients may show improved survival rates. Inferential statistics help estimate whether this effect would likely apply to all patients with the same condition.
Accurate inference depends on proper sampling. A sample must represent the target population to avoid biased results.
For detailed guidance on sampling strategies in clinical research, see the NIH Sampling Methods in Clinical research.
Hypothesis testing evaluates whether differences observed in the sample reflect real effects in the population.

Statistical tests generate a p-value indicating how likely the observed results would occur if the null hypothesis were true.
For example, if a p-value is 0.03, there’s a 3% chance the results are due to random variation, suggesting a meaningful effect.
A confidence interval gives a range of values likely to include the true population effect.
In a study of blood pressure medication, a 95% confidence interval might estimate that the true average reduction in systolic blood pressure falls between 8 and 12 mmHg.
For a deeper explanation of confidence intervals applied in clinical research, refer to this NLM Confidence Intervals Guide.
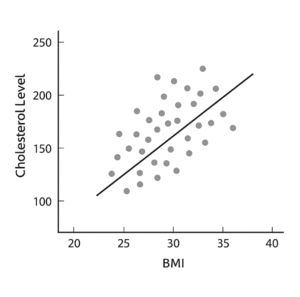
Inferential methods also explore relationships between variables:
Regression models estimate how one or more independent variables (such as age, medication dose, or lifestyle factors) affect a dependent variable, like blood pressure or cholesterol levels.
Regression methods are widely used to analyze relationships between clinical risk factors and outcomes. See this article Regression Analyses and Their Particularities in Observational Studies for further reading.
In most medical studies, both descriptive and inferential statistics are used — but at different stages and for different purposes.
Descriptive statistics are typically used at the start of any analysis to provide a clear overview of the data collected:
Inferential statistics are applied when the goal is to answer research questions that go beyond the specific sample:
Example:
A hospital conducts a study on a new diabetes drug:
Whether analyzing a small clinic’s data or estimating trends across an entire population, using the right statistical approach is essential for producing reliable results.
Even with good data, mistakes in applying or interpreting statistics can lead to misleading conclusions. Here are common errors seen in medical research:
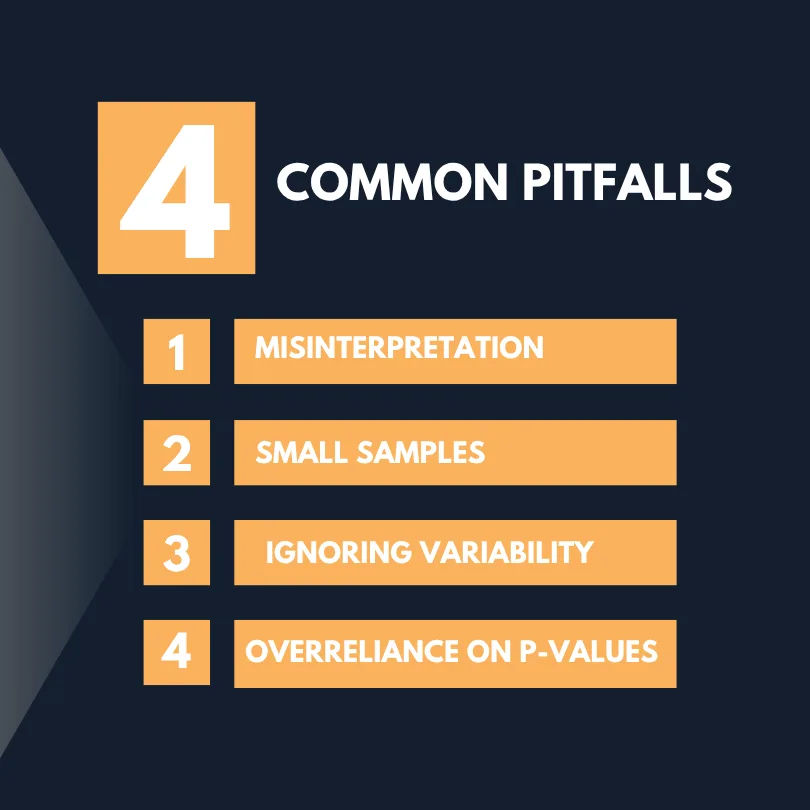
Reporting an average value from a sample does not automatically mean that result applies to the broader population. Without proper inferential testing, researchers risk overgeneralizing based on limited data.
Small sample sizes often produce unstable results. Inferential methods rely on adequate sample sizes to minimize random error and improve precision.
Focusing only on averages can hide important variations in patient responses. Always consider measures of dispersion to understand variability.
A statistically significant p-value does not always mean the result is clinically meaningful. Clinical importance should also consider effect size and confidence intervals.
Misinterpreting p-values is a frequent issue in published medical studies.
Both descriptive and inferential statistics are essential tools in medical research. Descriptive statistics provide a clear summary of data collected from a study, helping researchers understand patterns and variability within the sample. Inferential statistics allow those findings to be extended to larger populations, guiding clinical decisions, shaping public health policies, and advancing medical knowledge.
By understanding when and how to apply each method, healthcare professionals and researchers can interpret data more accurately and avoid common mistakes that lead to misleading conclusions.
Descriptive statistics summarize data from a sample, showing patterns such as averages and variability. Inferential statistics use sample data to make generalizations about a larger population.
An example is reporting the average cholesterol level in a group of 300 patients.
An example is using data from a clinical trial to estimate how effective a new drug might be for all patients with a certain disease.
Descriptive statistics: summarize data already collected.
Inferential statistics: make generalizations about populations based on samples.
Predictive statistics: forecast future outcomes using existing data.
Yes. Most medical studies begin with descriptive statistics to summarize the sample, followed by inferential statistics to test hypotheses or estimate broader effects.